|
|
|

Title: Air/Fuel Ratio Verses Driving Patterns
Question: Fuel mileage on any vehicle is often associated with how a person drives. In reality fuel mileage is directly related to engine efficiency. Research shows that engine efficiency is related to the air/fuel ratio and driving patterns. How do driving patterns effect air/fuel ratio and the efficiency of an engine?
Question: Fuel mileage on any vehicle is often associated with how a person drives. In reality fuel mileage is directly related to engine efficiency. Research shows that engine efficiency is related to the air/fuel ratio and driving patterns. How do driving patterns effect air/fuel ratio and the efficiency of an engine?

Answer: Over the past years research has shown that if the air/fuel ratio is close to 14.7 to 1, the engine efficiency and fuel consumption will be maximized. However, many things cause the air/fuel ratio to be upset if changed from this optimum ratio. Some of the factors that effect air/fuel ratio include:
--air density and altitude,
--acceleration of the vehicle
to increase speed,
--deceleration of the vehicle
to reduce speed,
--temperature of the input
air,
--speed of the engine and
vehicle,
--moisture content of the
air,
--load on the engine, and
--condition of the engine.
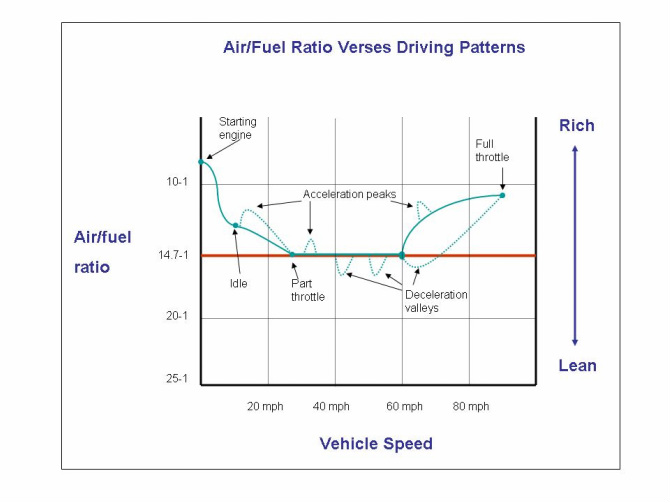
The fuel system is designed to operate under many of these conditions. The illustration above shows how the air/fuel ratio will change under changing driving patterns. The bottom axis represents the vehicle speed. The left axis represents the air/fuel ratio with the red line representing a 14.7-1 air/fuel ratio. Above the red line means a richer mixture while below the red line represent a leaner mixture. The blue/green line shows a representation of the air/fuel ratio over different driving speeds. For example, when starting the engine, the air/fuel ratio would be about 8-1, a very rich mixture. When the vehicle is stopped and the engine is at idle, the air/fuel ratio would be about 13-1. During moderate driving speeds (23 – 60 mph) the air/fuel ratio would be close to the 14.7-1 ratio.
In order to increase in speed, acceleration peaks are shown for reference. For example, to get from idle to part throttle, the air/fuel ratio needs to be richer. After increasing in speed the air/fuel ratio then levels of at 14.7-1. Other acceleration peaks are shown which also represents increasing the vehicle speed. At fuel throttle, the air/fuel ratio is very rich, about 11-1. To slow the vehicle down, the operator decelerates. Slowing down is shown by the deceleration valleys. During deceleration the air/fuel ratios are more lean, say, 17-1.
Keep in mind that this illustration is only a representation of driving patterns. Each operator’s driving patterns are different. Some drivers accelerate more than necessary. This causes the engine to run richer, reducing engine efficiency and fuel mileage. Another pattern of driving may have many acceleration peaks and deceleration valleys. Again, the efficiency of the engine will decrease. Overall, the closer and more time the air/fuel ratio is at 14.7-1, the more efficient the engine and the better fuel economy.
Back to Q and A Segments
|
|